
Filtering and Exporting Analytics
This tutorial walks you through every filter available on the Analytics dashboard and shows you how to export a PDF report that matches exactly what you see on screen. By the end, you'll be able to pull a focused, shareable report for any combination of time period, display, and project snapshot—useful whether you're preparing a quarterly review for a museum client or checking performance after a content update.
The Analytics dashboard and its filter bar
The Analytics page shows how visitors are engaging with your deployed project. Before diving into the charts, take a moment to set the scope of the data using the three filter dropdowns at the top of the page.
Use the Last 7 days dropdown to choose a date range, All devices to narrow results to a specific display type, and All snapshots to focus on a particular deployed version. The filters work together—any combination you choose updates all the charts and tables on the page at once.
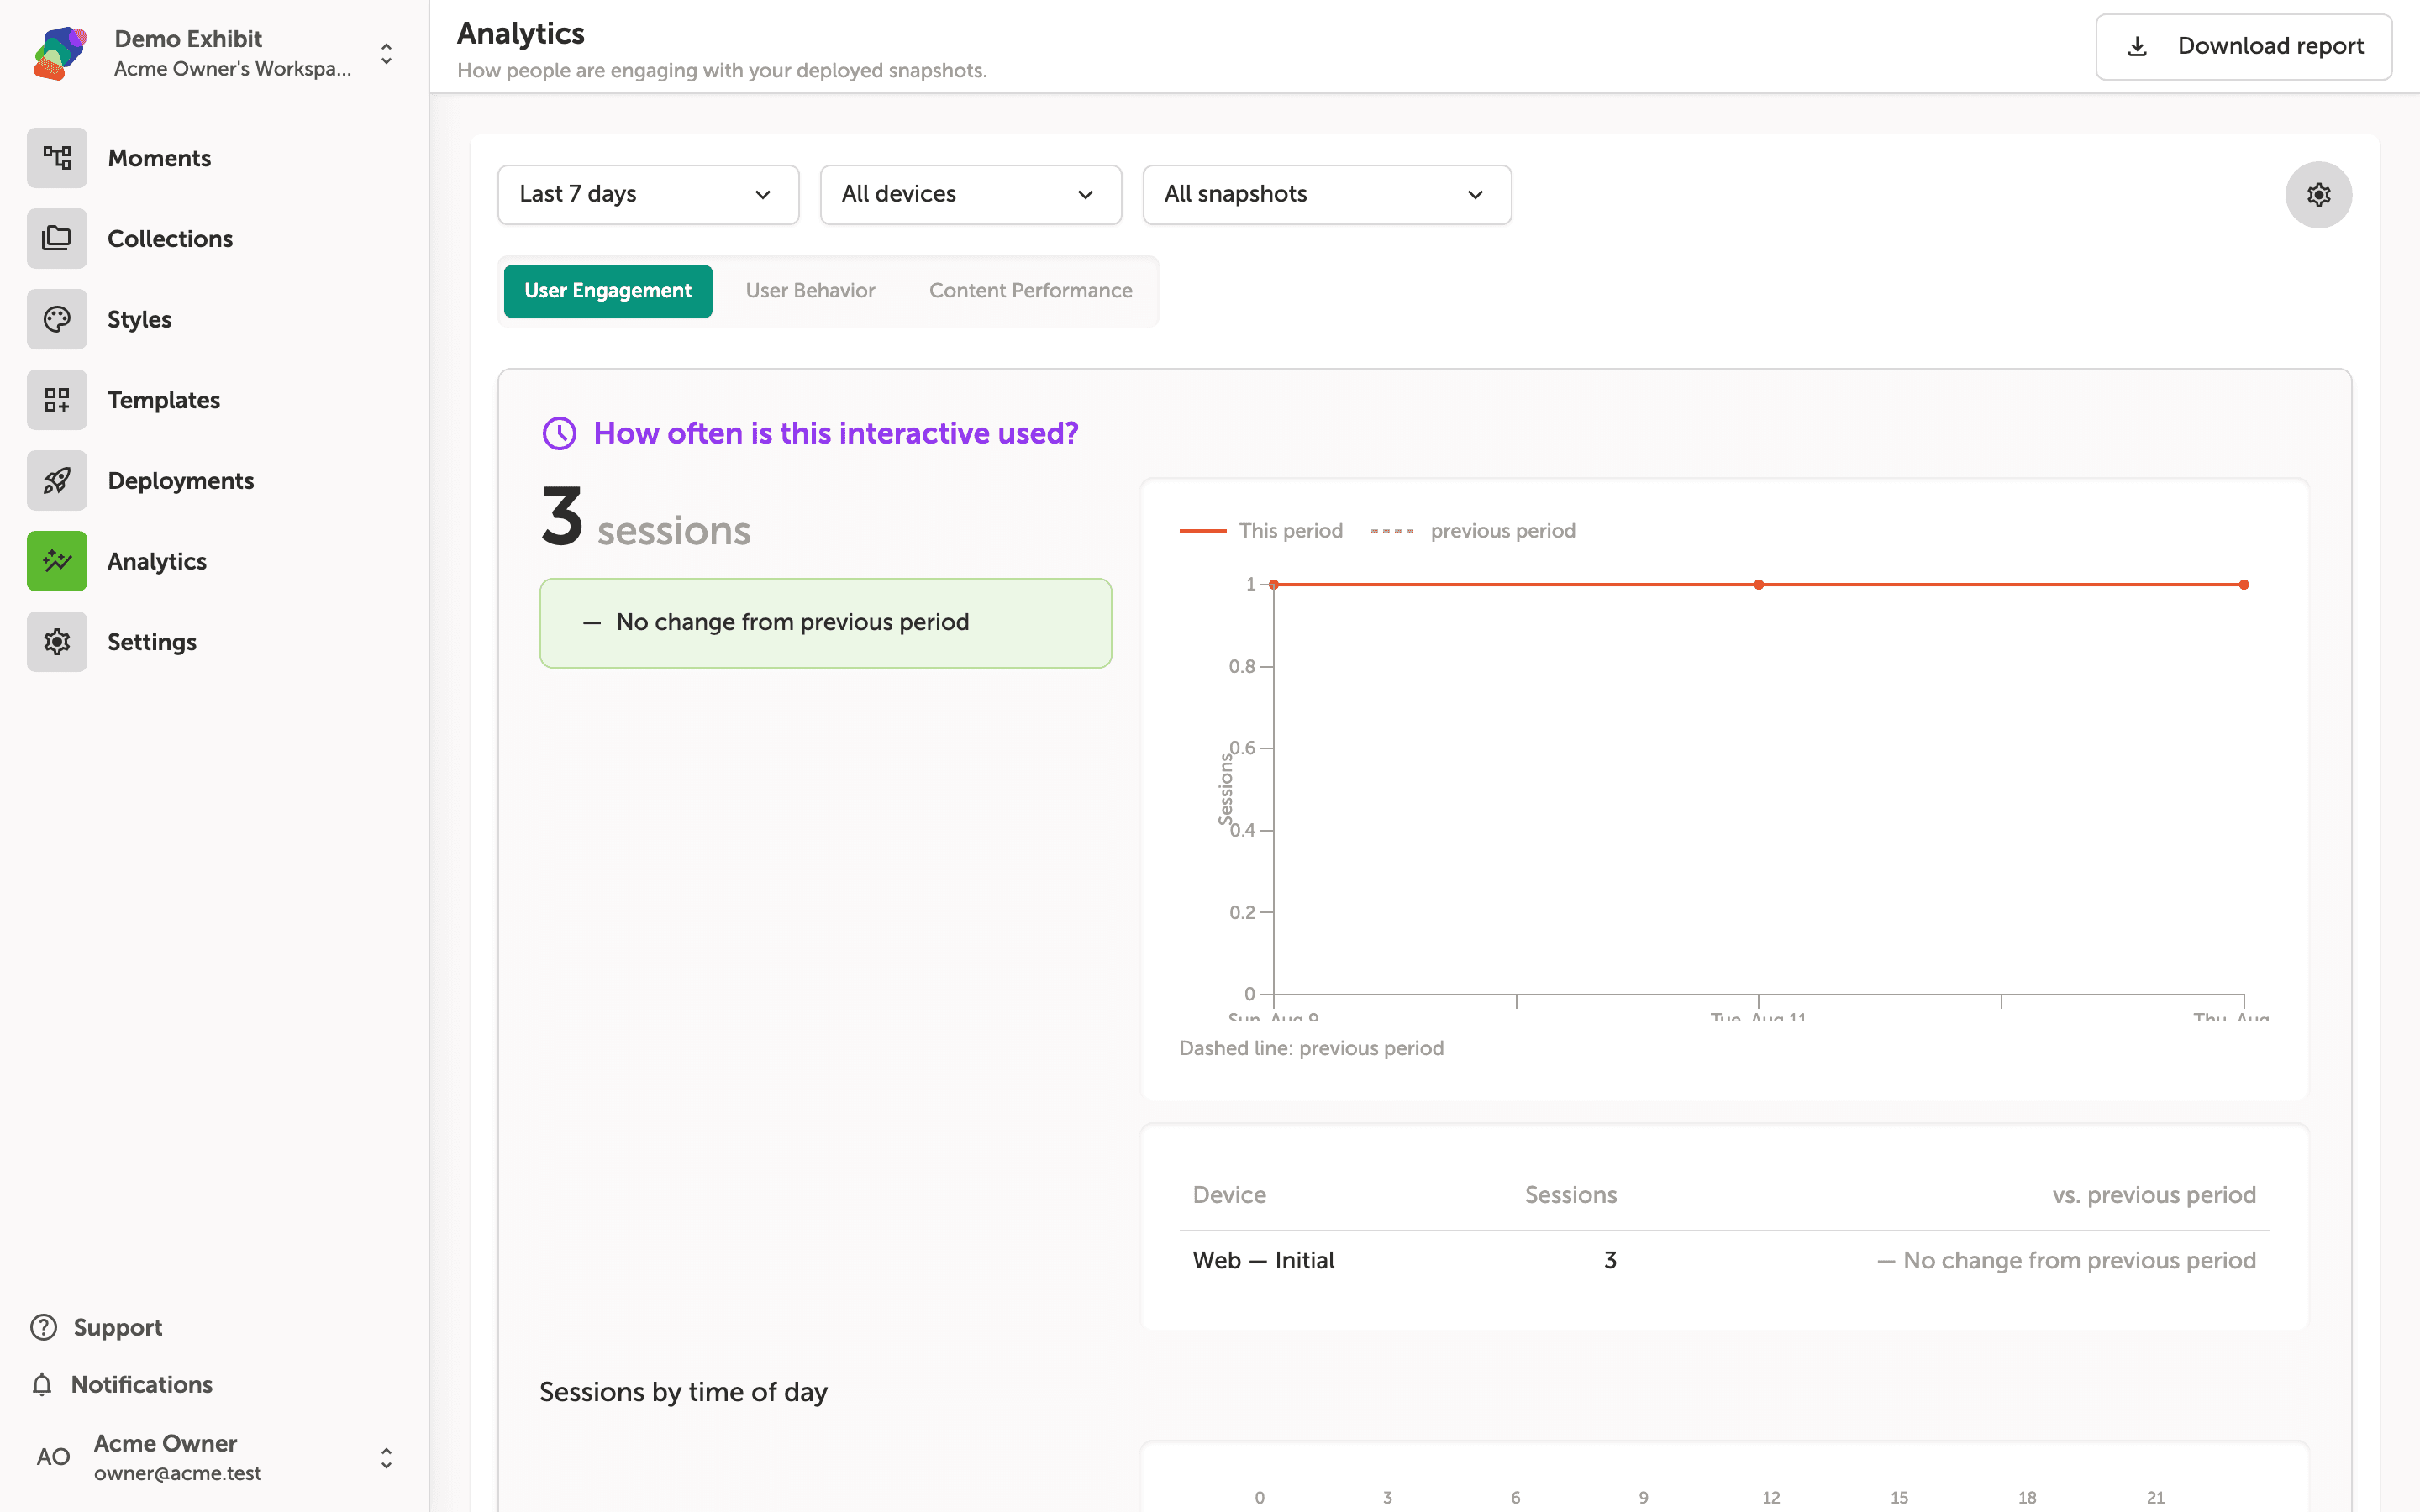
Choosing a date range for your analytics data
Click the "Last 7 days" dropdown at the top left of the filter bar to open the date range menu. You'll see six presets—"Last 7 days", "Last 30 days", "Last 90 days", "Last year", "Year-to-date", and "All time"—along with a "Custom time period" option if you need an exact date window.
Select any preset to instantly update all the charts and tables on the page. The currently active range is marked with a checkmark—"Last 7 days" is selected by default.
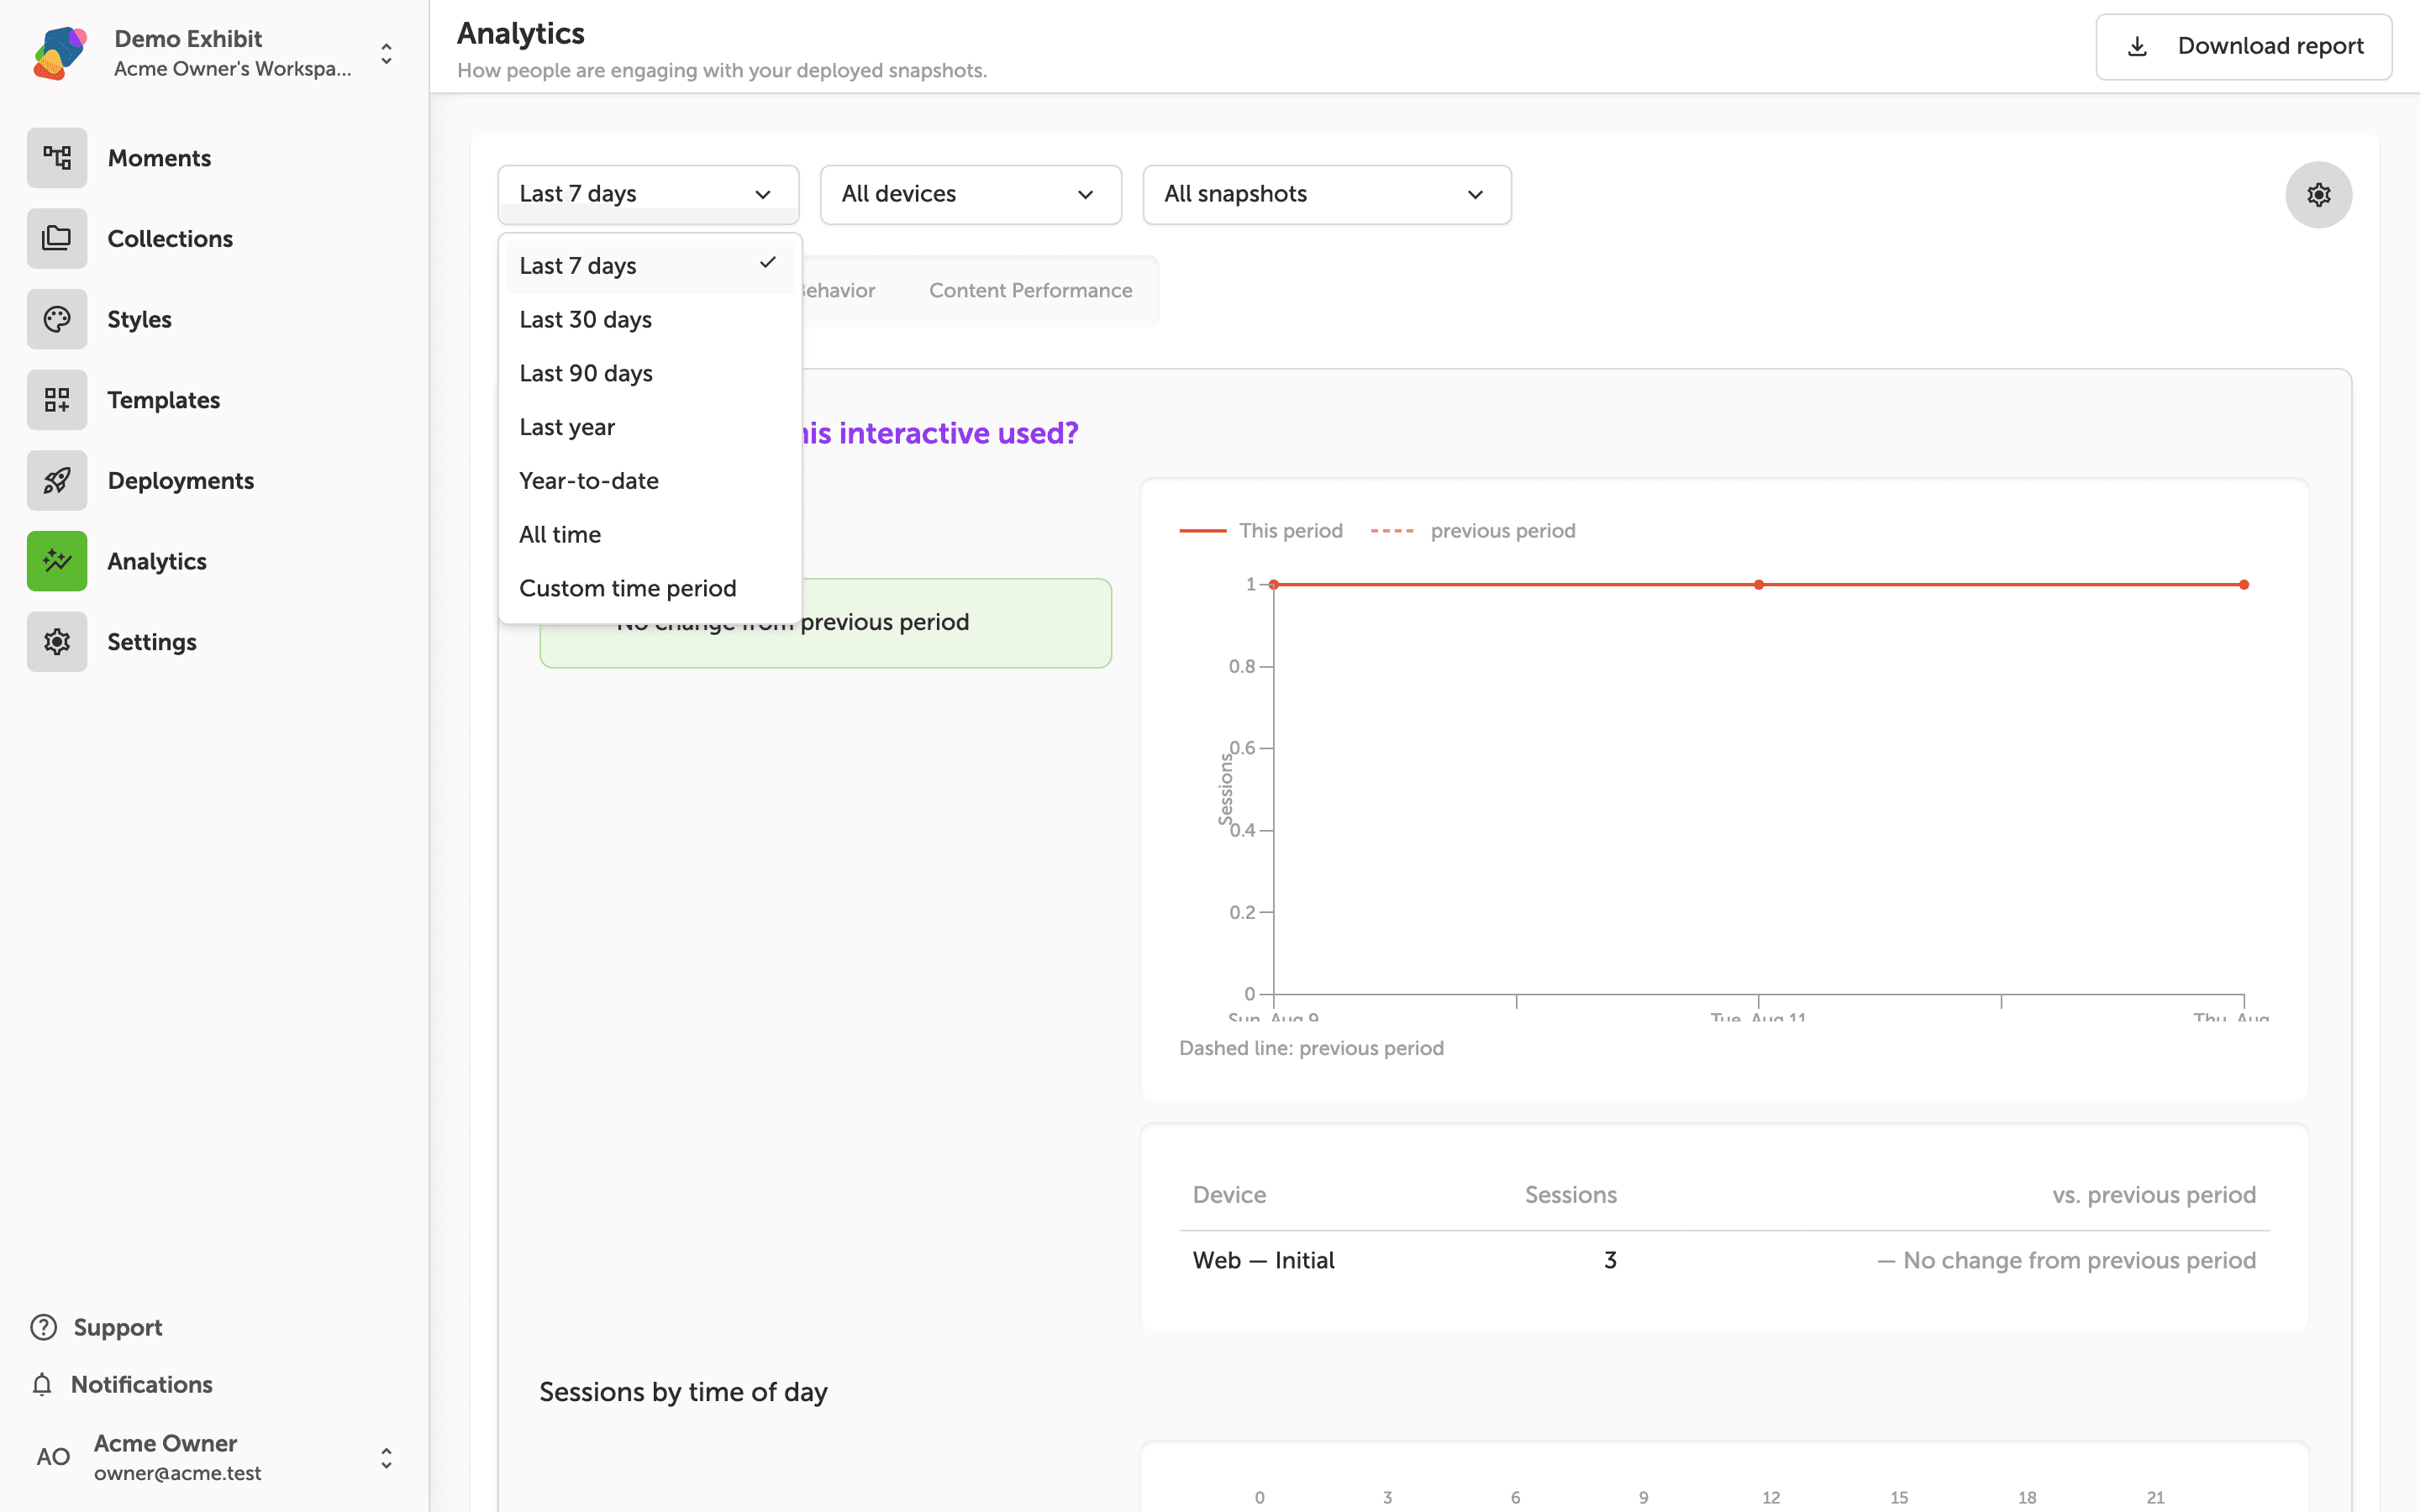
Narrowing results by display with the device filter
The All devices dropdown lets you focus the analytics data on a single registered display rather than viewing all of them together. Click All devices to open the menu—you'll see every display connected to this project listed alongside the All devices option. Select Web—Initial (or whichever display you want) and the session chart and breakdown table update immediately to show data for that display only.
This is especially useful when a project runs on multiple kiosks in different rooms and you need to compare engagement per station. The currently selected option shows a checkmark so you always know which filter is active.
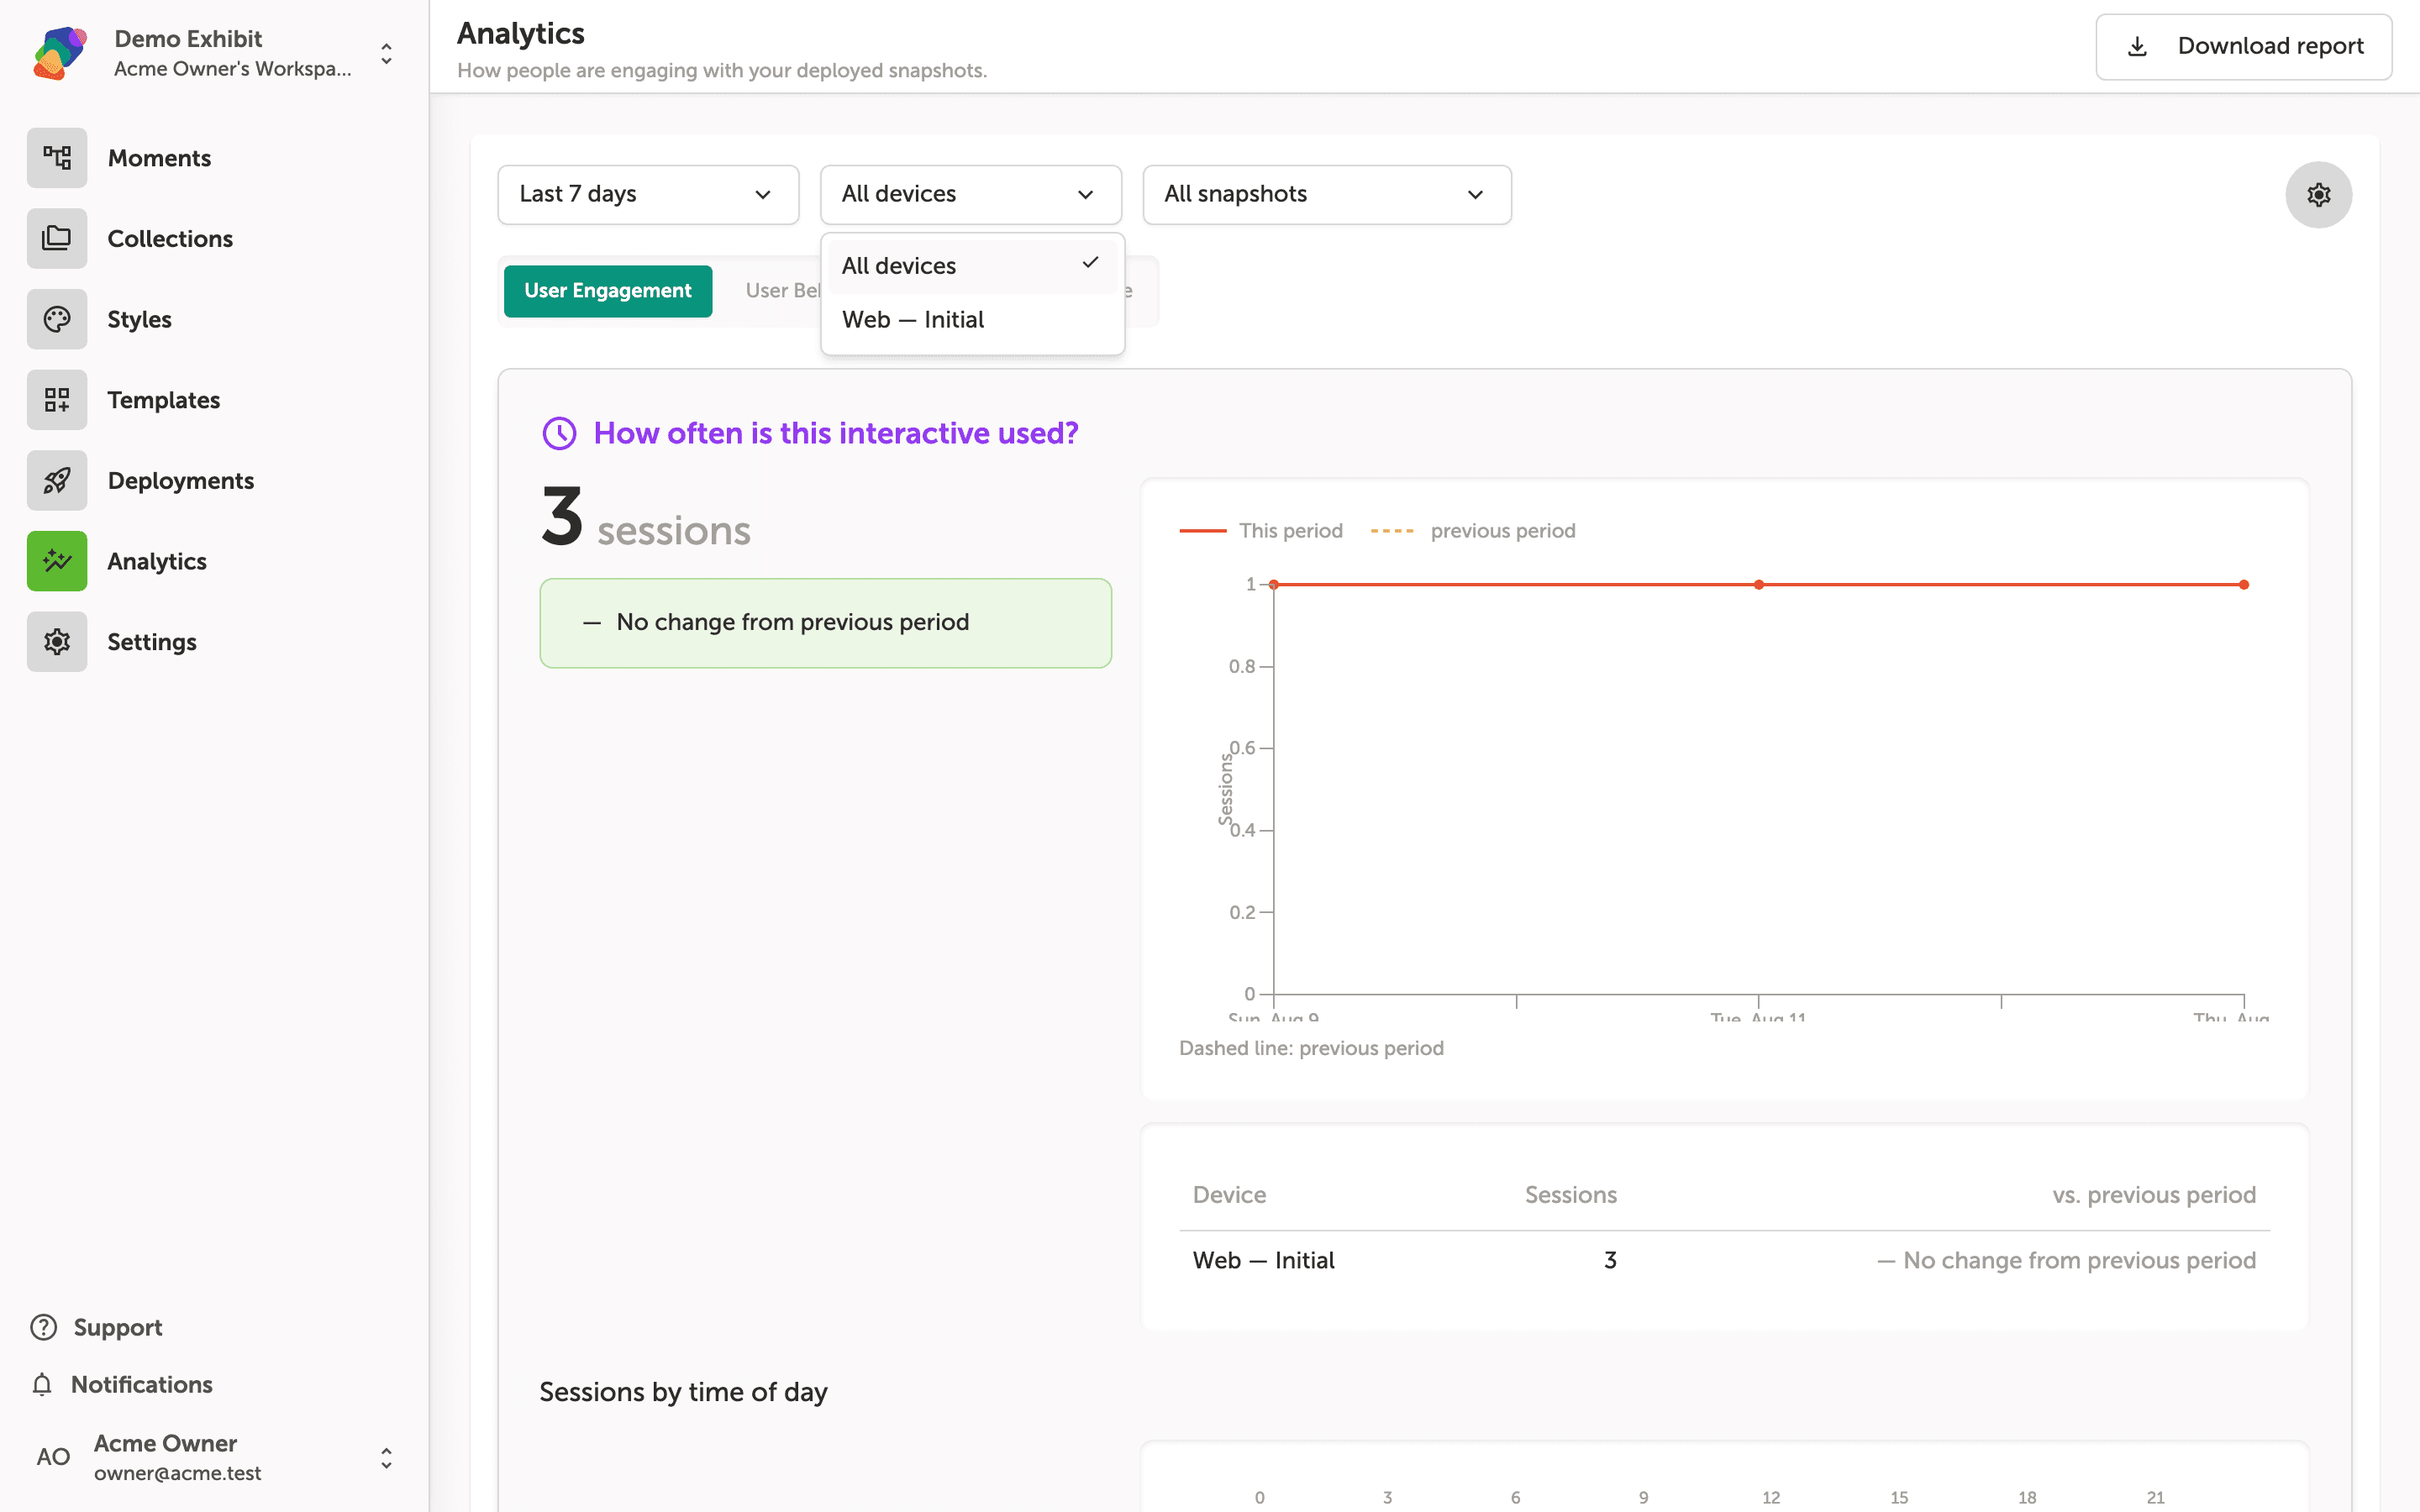
Filtering analytics by snapshot
The All snapshots dropdown lets you focus on a specific deployed version of your project. Open it to see two options: All snapshots (the default, which combines data from every deployment) and any named snapshots that have been published—in this case, Initial. Select a snapshot name to isolate engagement data for that deployment only.
This filter works alongside the date range and device filters, so you can combine them to answer precise questions—for example, how users on a specific display engaged with your first published version during a given week.
Setting chart granularity with Group data by
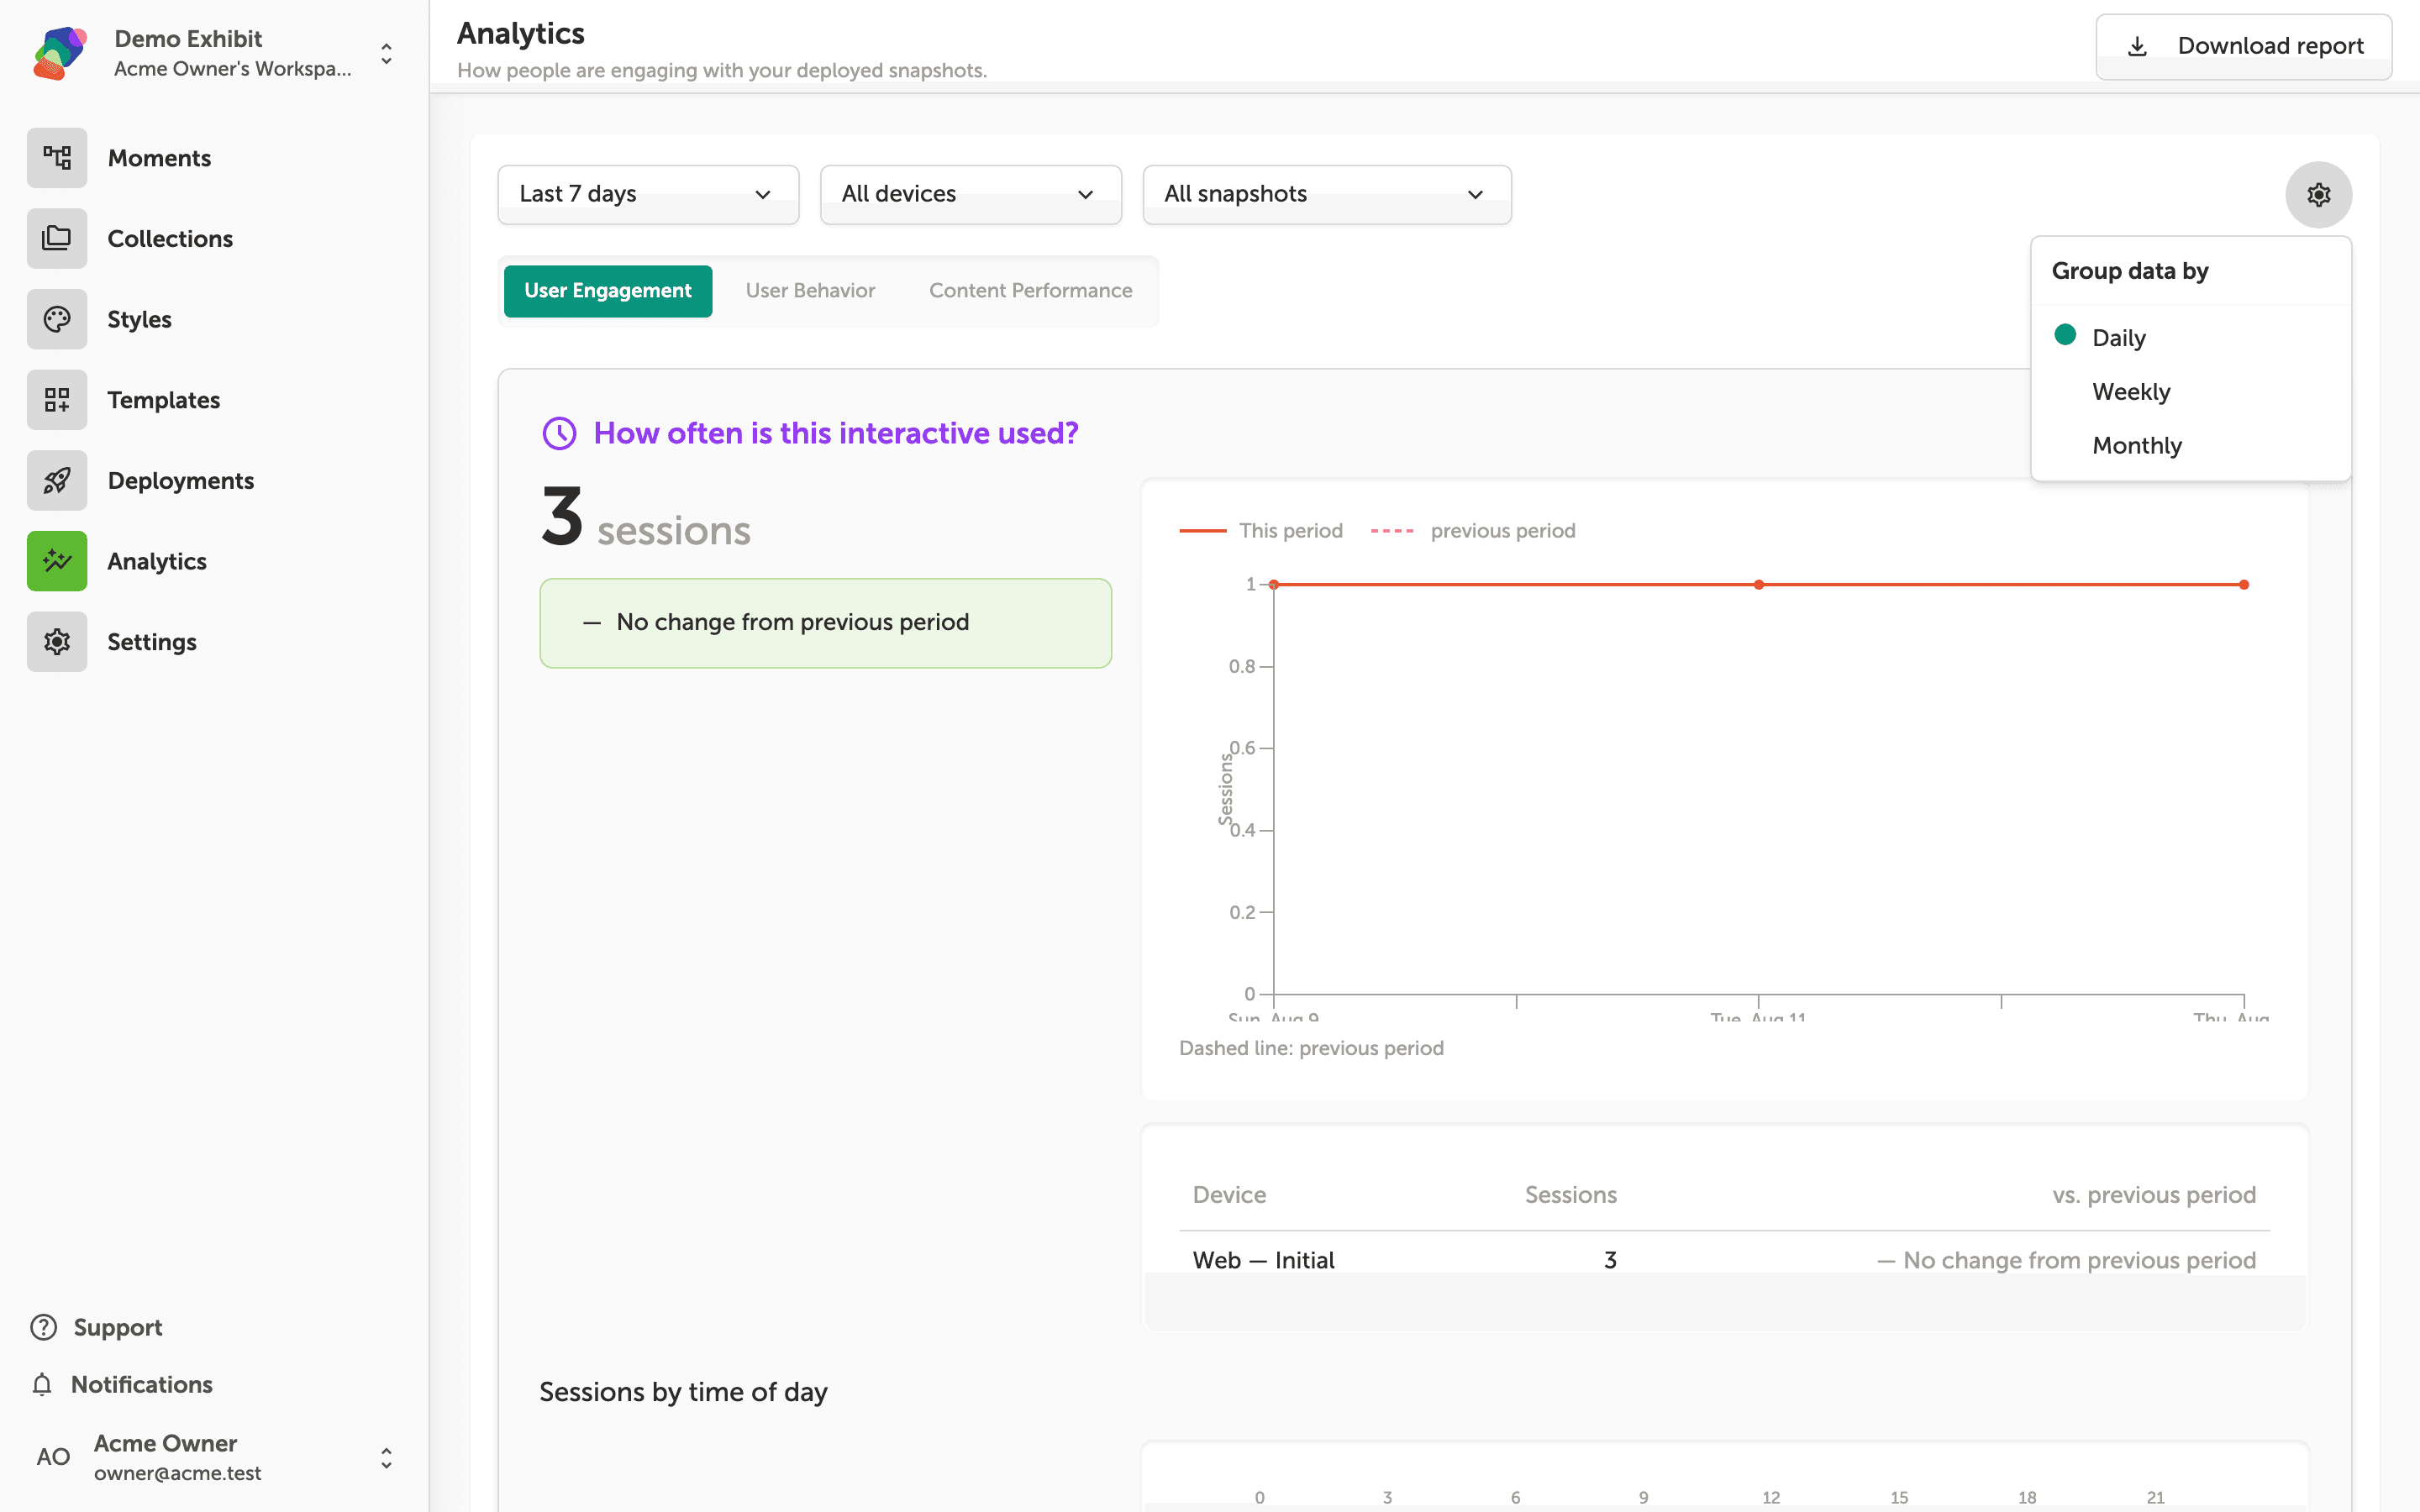
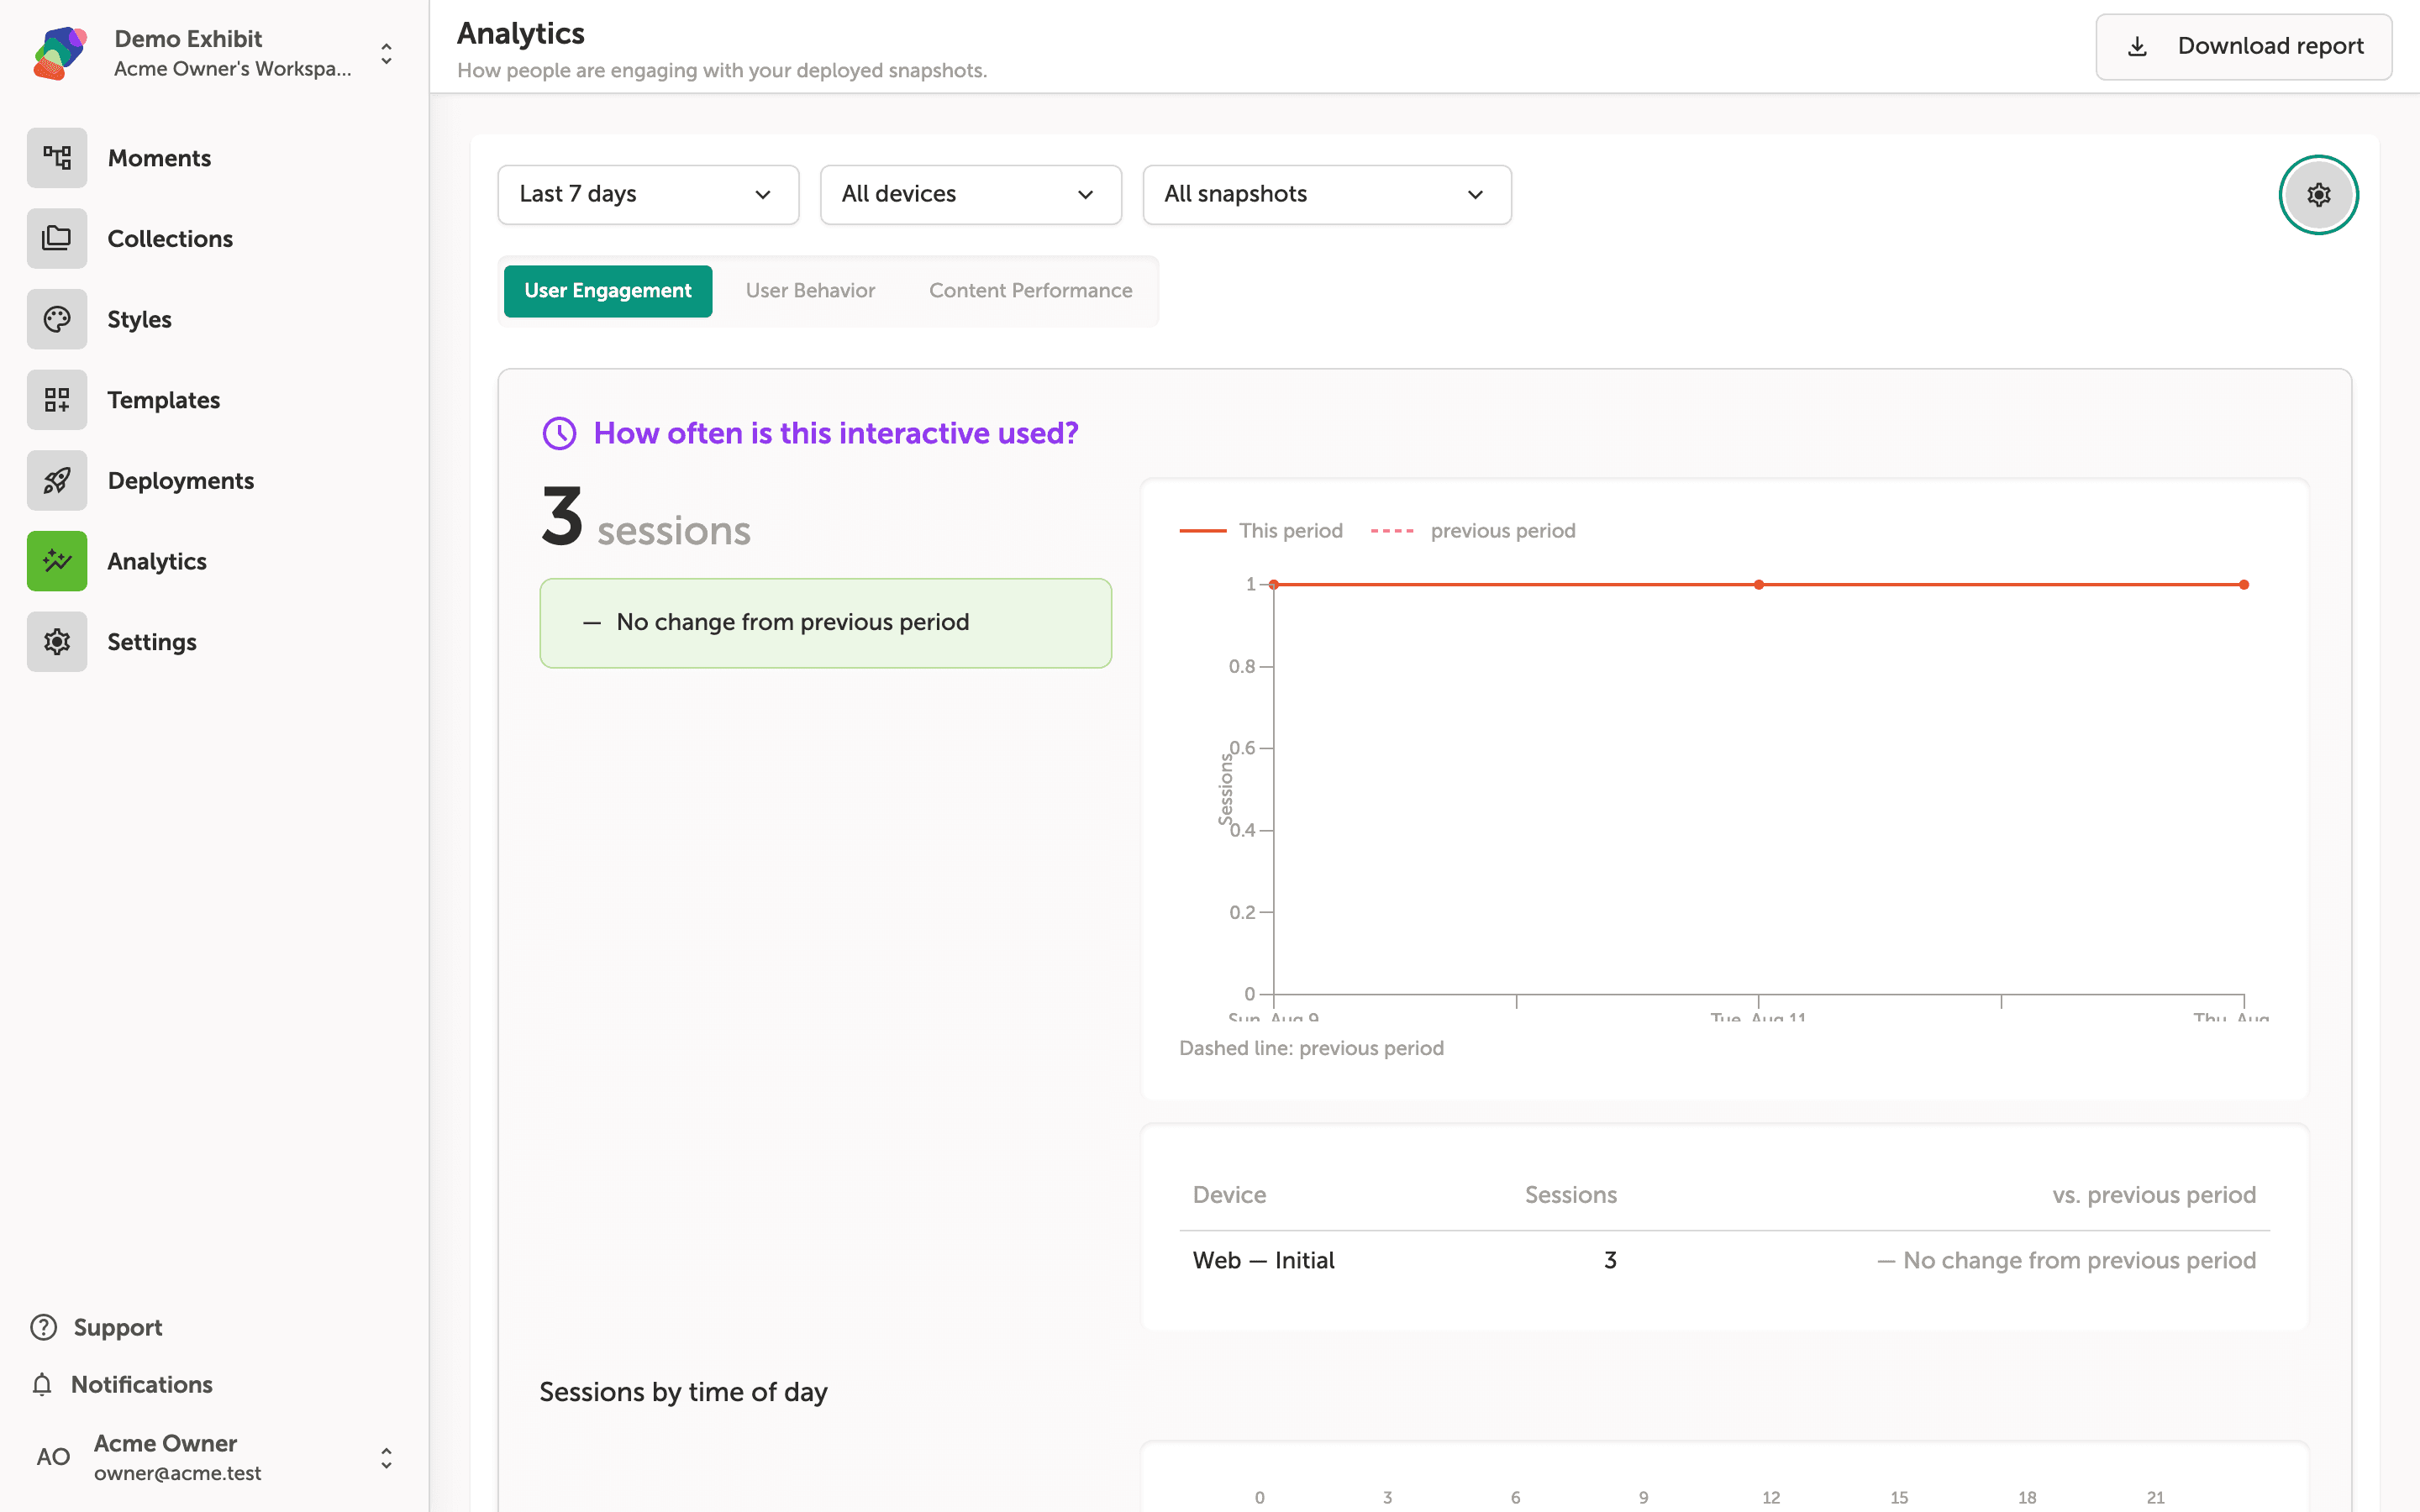
Click the settings icon at the top right of the chart area to open the Group data by panel. Select Daily, Weekly, or Monthly to control how the session data is bucketed along the horizontal axis of the engagement chart. Daily is selected by default when you choose a short date range like the last 7 days.
Choosing Weekly or Monthly smooths out day-to-day variation and is useful when you are reviewing longer time windows—for example, comparing foot traffic across several weeks at a gallery kiosk. The chart updates immediately when you switch options.
Exporting the filtered dashboard as a report
Once your filters are set, click "Download report" in the top-right corner of the Analytics header. Zibit exports a PDF snapshot of the dashboard exactly as it appears—including the selected date range, device, and snapshot filters—so the report reflects only the data you have scoped.
This is useful for sharing session data with colleagues or stakeholders who do not have access to the platform. The export captures all visible charts and tables from the current tab, so switch to "User Behavior" or "Content Performance" first if you want a report based on those views instead.
With your filtered report exported, you have a repeatable process for turning raw engagement data into clear, shareable insights. To go further with analytics and publishing in Zibit, explore these next steps:
- Compare snapshots over time—learn how snapshot versioning works so you can track the impact of content changes between deployments.
- Set up multiple displays—register and name additional displays in your space to make device filtering more meaningful across large installations.
- Schedule recurring exports—explore notification and integration settings to automate report delivery to your team.
- Dig into moment-level data—use per-moment engagement metrics to identify which parts of your project hold visitor attention longest.
- Share access with collaborators—invite teammates to your space so they can view and export analytics without needing your credentials.